Weekly NASDAQ Model Update - Mar 14, 2026: +27% CAGR Since 1999 - Today’s Signals & Stance
Our Tactical NASDAQ Model turned $10K into over $6 million with 27% annual returns since 1999 - crushing the NASDAQ. This week’s update reveals the model’s current position, market signals, and more.

📅 Date: 14.03.2026
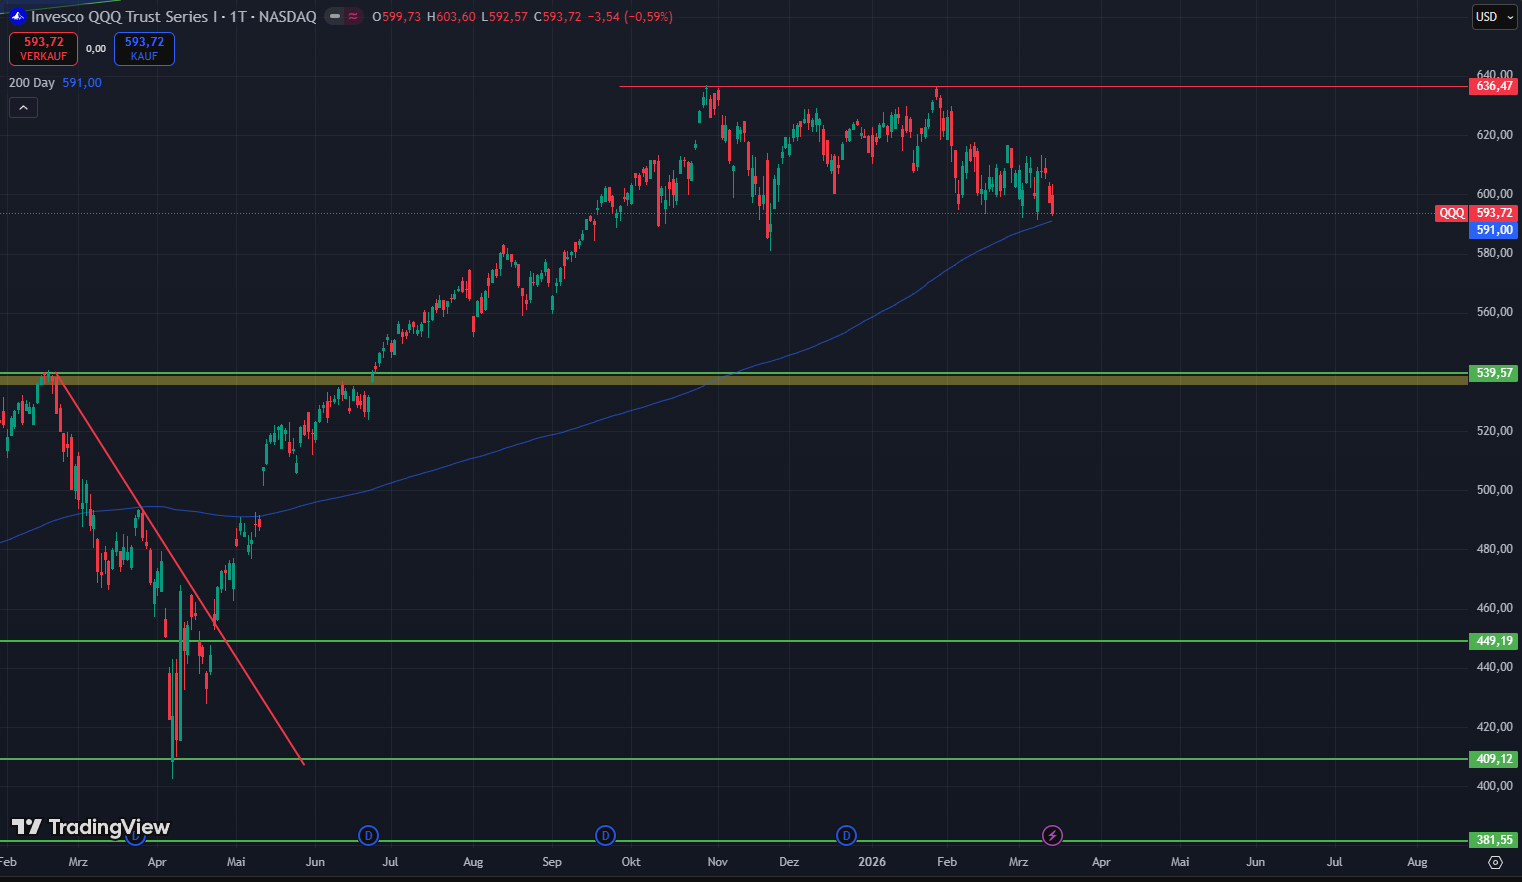
This week the Nasdaq closed at 22,105 — down another 0.93% on Friday alone, marking a third consecutive losing week and a new 2026 low. The driver is not a single shock but a toxic combination that markets find particularly difficult to price: the ongoing U.S.-Israel conflict with Iran has pushed oil above $90 per barrel, Brent crude advanced more than 11% on the week, and the jobs report on Friday showed an unexpected loss of 92,000 positions. Weak labor market. Rising inflation. The word stagflation is now appearing in mainstream financial coverage with increasing frequency.
What makes this environment particularly dangerous for leveraged investors is not the direction — it is the character. This has not been a clean, fast crash. It has been a grinding, uncertain, directionless selloff punctuated by false recoveries. Mid-week the market bounced on Oracle earnings and stabilizing oil prices, briefly turning positive before selling off again into Friday. Every recovery attempt failed to generate the kind of sustained follow-through that would signal a genuine reversal. The tape moved, but it never committed.
The Fed meets next week on March 18-19. Rate cut expectations have been pushed out to December. The market is caught between two mandates pointing in opposite directions — a weakening labor market that argues for cuts, and oil-driven inflation that argues against them. The FOMC is widely expected to hold, and Powell will face difficult questions about a policy path that has no clean answer.
This is exactly the regime the system was built to avoid.
Full module status, current exposure, and what the system needs to see before the next entry — available for paid subscribers below.
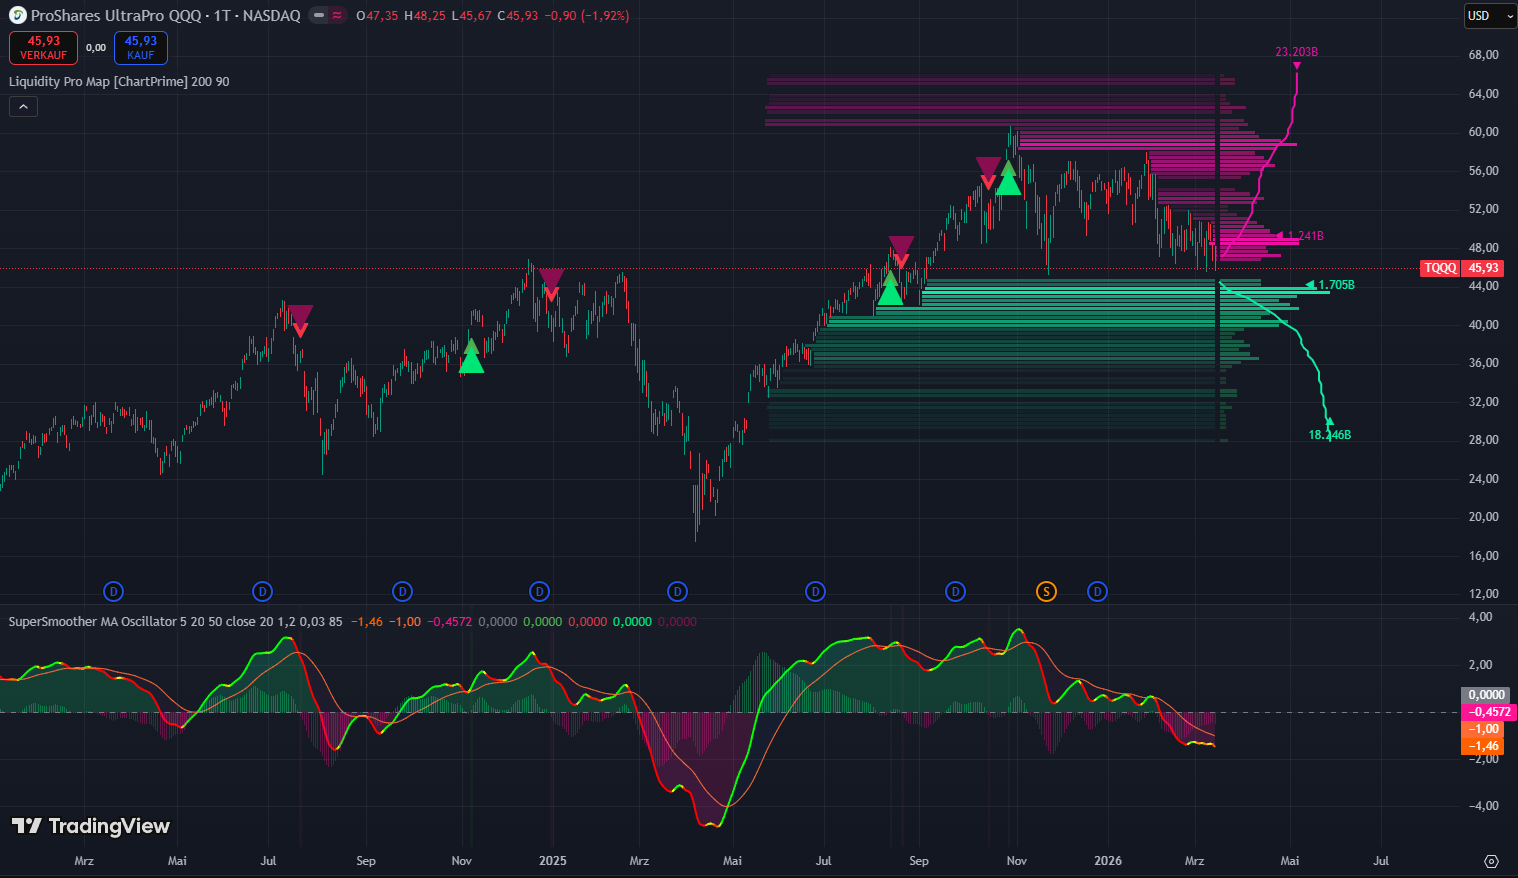
What we do: One instrument (TQQQ). Three fixed-weight engines (Core 50%, Momentum 25%, Short-Term 25%). Each is ON/OFF only, executed end-of-day. The equity curve since 1999 speaks for itself: ~27% per year(~65,000% cumulative). That compounding happens by being in durable trends and flat when the tape is fragile.
If you're serious about compounding wealth with discipline, now’s the time.
🟢 $0.60 a day.
🟢 Cancel anytime.
🟢 Join hundreds who stopped guessing and started operating.
🧩 Signal Check - Three-Model Dashboard
We run through all three models - Core 50%, Momentum 25%, Short-Term 25% -what moved, what’s one box from flipping, and the exact EOD confirmation we’re waiting on.
📘 Base Momentum Model